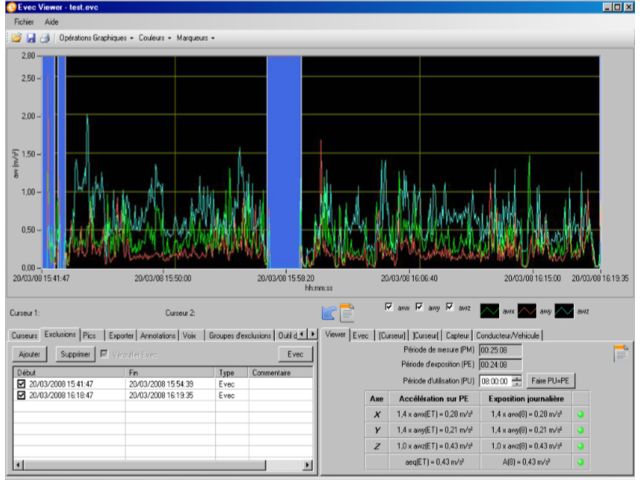
The EvecViewerDuo vibration analysis software allows the user to visualize vibration levels over time and simulate a new usage period different from that of the vehicle or machine.
It includes tools that facilitate the creation of customized measurement reports and the export of measurements in various formats (spreadsheet, text). EvecViewerDuo can display a graph that shows the measured accelerations with the sensors (Evec, EvecFloor, EvecDetect) as a function of time.
The operator can define exclusion zones in addition to those automatically generated by the Evec or EvecDetect. These zones can be activated or deactivated to understand their impact on exposure calculations.
This vibration analysis software is suitable for highlighting peaks in acceleration measurements. It allows users to define and comment on areas within the graph, change the graph scales, zoom in, and scroll through the curves.
It also allows importing voice recordings (made in parallel with the vibration measurements). These recordings can be analyzed and graphically correlated with the vibration levels corresponding to specific events or driving conditions.
The user can create customized measurement reports by copying the graph provided by this vibration analysis software.
Visualization of vibration levels over time.Simulation of new usage periods (vehicle or machine).Tools for creating customized reports.Export of measurements in multiple formats (spreadsheet, text).Graphs of accelerations measured (Evec, EvecFloor, EvecDetect) over time.Exclusion zones that can be activated/deactivated to analyze their impact on exposure calculations.Option to import and link voice recordings with vibration data.Zooming and scrolling functionality for vibration curves.